▣ Grafana 핵심 내용
1. 역할 : 데이터 시각화, 모니터링, 분석을 위한 오픈소스 플랫폼으로서, IT 인프라와 애플리케이션의 상태를 한눈에 파악할 수 있도록 돕는 대시보드 솔루션
2. 핵심 특징
| 역할 | 상세 내용 |
| 멀티 데이터소스 | Prometheus, InfluxDB, Loki, MySQL, Elasticsearch 등 동시 연결 |
| 패널 타입 | Time series, Gauge, Stat, Heatmap, Geomap, Table 등 다양 |
| Alert Rules | 데이터소스 쿼리 기반 알림 조건 설정 + Notification Channel 라우팅 |
| Loki | 로그 수집/쿼리 (LogQL), Prometheus와 동일한 레이블 체계 |
| Tempo | 분산 트레이싱 연동 (Traces) |
| 플러그인 | 커뮤니티/상용 패널·데이터소스 플러그인 수백 개 |
| 강력한 알람 기능 | 특정 데이터 임계치를 넘거나 문제가 발생했을 때 Slack, 이메일, PagerDuty 등으로 즉시 알림을 보냄 |
3. 활용 범위
- 서버/인프라 모니터링 : CPU 사용량, 메모리, 네트워크 트래픽 등 실시간 모니터링
- 애플리케이션 성능 추적 : API 응답 속도, 에러 발생률 추적
- 비즈니스 메트릭 : 특정 서비스의 사용자 접속 수, 매출 변화 등 실시간 통계
4. Grafana 데이터 흐름도

▣ Grafana Mimir 핵심 내용
1. 역할 : 방대한 규모의 Prometheus 메트릭을 장기 보관하고, 초고속 쿼리 성능을 제공하기 위해 설계된 멀티 테넌트(Multi-tenant) 분산 시계열 데이터베이스
2. 핵심 특징
| 역할 | 상세 내용 |
| 무한한 확장성 | 메트릭 수집(Ingester), 쿼리 실행(Querier), 데이터 저장(Store-gateway) 등 각 구성 요소를 독립적으로 확장할 수 있어 수십억 개의 시계열 데이터를 안정적으로 처리 가능 |
| 비용 효율적인 스토리지 | 메트릭 데이터를 S3, GCS 등의 객체 저장소에 분산 저장하여 로컬 디스크 대비 운영 비용을 획기적으로 절감 |
| 완벽한 Prometheus 호환 | Prometheus와 100% 호환되는 PromQL을 지원하여, 기존에 구축된 대시보드나 Alertmanager 설정을 수정 없이 그대로 사용 |
| 강력한 멀티 테넌시(Multi-tenancy) | 단일 클러스터 내에서 여러 팀이나 프로젝트별로 데이터를 완전히 격리하여 관리할 수 있으며, 서비스 제공자(SaaS) 환경에 최적화 |
| 고가용성 보장 | 데이터 복제(Replication) 기능을 통해 특정 노드에 장애가 발생해도 데이터 유실 없이 지속적인 모니터링 |
3. 활용 범위
- Prometheus 단일 노드나 Thanos만으로는 메트릭 처리 용량이나 쿼리 속도에 한계를 느낄 때
- 수백, 수천 개의 마이크로서비스에서 쏟아져 나오는 메트릭을 통합 관리해야 할 때
- 조직 내 여러 팀이 하나의 모니터링 인프라를 공유하면서 데이터 보안 및 격리가 필요할 때
▣ Loki 핵심 내용
1. 역할 : 로그 수집, 저장, 쿼리를 위한 클라우드 네이티브 로그 집계 시스템
2. 핵심 특징
| 역할 | 상세 내용 |
| 고효율/저비용 인덱싱 | 로그 전체 본문을 인덱싱하지 않고, Prometheus와 동일한 구조의 레이블(Label)만 인덱싱하여 스토리지 비용과 메모리 사용량을 극적으로 절감 |
| LogQL 지원 | Prometheus의 PromQL과 매우 유사한 문법을 사용하여 메트릭과 로그를 넘나드는 일관된 쿼리 경험 제공 |
| Grafana 생태계 완벽 통합 | Grafana 대시보드에서 메트릭(Prometheus) 그래프의 특정 시점을 클릭하면, 그 시간에 발생한 로그(Loki)로 즉시 전환되는 상호 연동성 |
| 오브젝트 스토리지 활용 | AWS S3, Google Cloud Storage 등 저렴한 클라우드 스토리지를 메인 저장소로 사용할 수 있어 대용량 장기 보존에 유리 |
3. 활용 범위
- Prometheus와 함께 마이크로서비스/Kubernetes 환경을 구축할 때, 비용 효율적이고 가벼운 중앙 집중형 로그 시스템이 필요할 때
▣ Grafana Tempo 핵심 내용
1. 역할 : 분산 환경에서 발생하는 분산 트레이싱(Distributed Tracing) 데이터를 대규모로 저장하고, 고속으로 검색 및 조회할 수 있도록 설계된 클라우드 네이티브 백엔드 스토리지
2. 핵심 특징
| 역할 | 상세 내용 |
| 비용 효율적인 오브젝트 스토리지 활용 | S3, GCS, Azure Blob Storage 등 비용이 저렴한 객체 저장소를 사용하여 방대한 양의 트레이스 데이터를 경제적으로 보관 |
| 고성능 대규모 처리 | 인덱싱을 최소화하고 데이터 파티셔닝 전략을 사용하여, 수십억 개의 트레이스 데이터 속에서도 필요한 정보를 즉각적으로 추출할 수 있는 압도적인 읽기 성능을 제공 |
| 완벽한 텔레메트리 연동 (Correlation) | 트레이스 ID를 활용하여 Grafana 대시보드 내에서 메트릭, 로그, 트레이스를 하나의 맥락(Context)으로 연결(예: 특정 오류 로그를 클릭하여 해당 트레이스 바로 확인) |
| OpenTelemetry 표준 준수 | OTLP(OpenTelemetry Protocol)를 기본적으로 지원하여, 별도의 변환 작업 없이 최신 오픈소스 트레이싱 생태계와 즉시 통합 가능 |
| 운영 간소화 | 복잡한 데이터베이스 클러스터 관리 없이 설정이 간편하며, Grafana Cloud 및 OSS 환경 모두에서 확장성 있는 추적 시스템을 구축 |
3. 활용 범위
- 마이크로서비스 아키텍처(MSA)에서 서비스 간 호출 관계를 시각화하고 병목 구간을 빠르게 찾아내야 할 때
- 기존의 고비용 트레이싱 솔루션(Elasticsearch 기반 등)에서 벗어나 저렴한 비용으로 대규모 데이터를 장기 보관하고 싶을 때
- 메트릭, 로그와 트레이스를 긴밀하게 연결하여 통합 가시성(Observability)을 극대화하고자 할 때
▣ Grafana Alloy 핵심 내용
1. 역할 : 메트릭, 로그, 트레이스, 프로파일 등 텔레메트리 데이터를 모두 수집하고, 전달하는 통합 차세대 에이전트
2. 핵심 특징
| 역할 | 상세 내용 |
| OpenTelemetry(OTel) 완벽 호환 | OTel Collector 표준 사양을 완벽히 지원하며, Prometheus 및 기존 Grafana 생태계 파이프라인과도 100% 호환 |
| 컴포넌트 기반 구성 | 수집(Discovery), 처리(Processing), 전송(Exporting) 단계를 컴포넌트 단위로 모듈화하여 복잡한 데이터 파이프라인을 유연하게 설계 가능 |
| 선언형 설정 언어 (Alloy Language) | 기존 복잡한 YAML 대신, 가시성이 높고 동적 변경이 용이한 선언형 설정 문법을 도입하여 대규모 에이전트 관리가 수월 |
| 멀티 시그널 처리 | 하나의 에이전트 프로세스만으로 CPU/메모리 메트릭, 애플리케이션 로그, 분산 트레이스 데이터를 동시에 수집 및 라우팅 가능 |
3. 활용 범위
- 분산되어 있던 다양한 수집 에이전트(Promtail, Telegraf 등)를 하나로 통합하고, 오픈소스 표준(OTel) 기반의 모니터링 파이프라인을 구축하고 싶을 때
▣ Grafana 설치 방법
1. 디렉토리 구조 및 권한 설정
|
[root@localhost ~]# mkdir -p /APP/monitoring/alloy/config
[root@localhost ~]# mkdir -p /APP/monitoring/compose
[root@localhost ~]# mkdir -p /APP/monitoring/grafana/{data,log}
[root@localhost ~]# mkdir -p /APP/monitoring/loki/{config,data}
[root@localhost ~]# mkdir -p /APP/monitoring/mimir/{config,data}
[root@localhost ~]# mkdir -p /APP/monitoring/tempo/{config,data}
[root@localhost ~]# mkdir -p /APP/monitoring/tempo/data/blocks
[root@localhost ~]# mkdir -p /APP/monitoring/tempo/data/wal
[root@localhost ~]# touch /APP/monitoring/alloy/config/config.alloy
[root@localhost ~]# touch /APP/monitoring/loki/config/loki-config.yaml
[root@localhost ~]# touch /APP/monitoring/mimir/config/mimir.yaml
[root@localhost ~]# touch /APP/monitoring/tempo/config/tempo.yaml
[root@localhost ~]# chmod -R 777 /APP/monitoring/grafana/data
[root@localhost ~]# chmod -R 777 /APP/monitoring/grafana/log
[root@localhost ~]# chmod -R 777 /APP/monitoring/tempo/data
[root@localhost ~]# chown -R 1000:1000 /APP/monitoring/grafana
[root@localhost ~]# chown -R 1000:1000 /APP/monitoring/grafana/data /APP/monitoring/grafana/log
[root@localhost ~]# chown -R 10001:10001 /APP/monitoring/loki /APP/monitoring/tempo
[root@localhost ~]# chown -R 10001:10001 /APP/monitoring/loki/data
[root@localhost ~]# chown -R 10001:10001 /APP/monitoring/mimir /APP/monitoring/loki /APP/monitoring/tempo /APP/monitoring/alloy
[root@localhost ~]# chown -R 10001:10001 /APP/monitoring/tempo
[root@localhost ~]# chown -R 10001:10001 /APP/monitoring/tempo/config/tempo.yaml
[root@localhost ~]# chown -R 10001:10001 /APP/monitoring/tempo/data
[root@localhost ~]# chcon -Rt svirt_sandbox_file_t /APP/monitoring/tempo
[root@localhost ~]# chcon -Rt svirt_sandbox_file_t /APP/monitoring/grafana
[root@localhost ~]# chcon -Rt svirt_sandbox_file_t /APP/monitoring
|
2. 환경 변수 파일 설정
[root@localhost ~]# vi /APP/monitoring/compose/.env
|
MONITORING_ROOT=/APP/monitoring
GRAFANA_PORT=3000
MIMIR_PORT=9009
LOKI_PORT=3100
TEMPO_PORT=3200
ALLOY_PORT=12345
TZ=Asia/Seoul
|
3. Podman Compose 파일 작성
[root@localhost ~]# vi /APP/monitoring/compose/podman-compose.yml
|
services:
# 1. Grafana
grafana:
image: docker.io/grafana/grafana-oss:latest
user: "0:0"
container_name: grafana
ports:
- "${GRAFANA_PORT}:3000"
volumes:
- ${MONITORING_ROOT}/grafana/data:/var/lib/grafana:Z
- ${MONITORING_ROOT}/grafana/log:/var/log/grafana:Z
environment:
- TZ=${TZ}
restart: always
# 2. Mimir (메트릭 저장소)
mimir:
image: docker.io/grafana/mimir:latest
container_name: mimir
ports:
- "${MIMIR_PORT}:9009"
volumes:
- ${MONITORING_ROOT}/mimir/config/mimir.yaml:/etc/mimir/mimir.yaml:z
- ${MONITORING_ROOT}/mimir/data:/data:Z
command: -config.file=/etc/mimir/mimir.yaml
restart: always
# 3. Loki (로그 집계)
loki:
image: docker.io/grafana/loki:latest
container_name: loki
ports:
- "${LOKI_PORT}:3100"
volumes:
- ${MONITORING_ROOT}/loki/config/loki-config.yaml:/etc/loki/loki-config.yaml:z
- ${MONITORING_ROOT}/loki/data:/loki:Z
command: -config.file=/etc/loki/loki-config.yaml
restart: always
# 4. Tempo (트레이싱)
tempo:
image: docker.io/grafana/tempo:latest
container_name: tempo
ports:
- "${TEMPO_PORT}:3200"
volumes:
- ${MONITORING_ROOT}/tempo/config/tempo.yaml:/etc/tempo/tempo.yaml:z
- ${MONITORING_ROOT}/tempo/data:/var/tempo:Z
command: -config.file=/etc/tempo/tempo.yaml
restart: always
# 5. Alloy (텔레메트리 에이전트)
alloy:
image: docker.io/grafana/alloy:latest
container_name: alloy
ports:
- "${ALLOY_PORT}:12345"
volumes:
- ${MONITORING_ROOT}/alloy/config/config.alloy:/etc/alloy/config.alloy:z
- /var/log:/var/log:ro,rslave
command: run --server.http.listen-addr=0.0.0.0:12345 /etc/alloy/config.alloy
restart: always
|
4. Mimir YMAL 설정
[root@localhost ~]# vi /APP/monitoring/mimir/config/mimir.yaml
|
multitenancy_enabled: false # 단일 테넌트 모드 (다중 사용 시 true)
blocks_storage:
backend: filesystem # 대규모 운영 시 's3', 'gcs' 등으로 변경 권장
filesystem:
dir: /data/mimir/blocks
compactor:
data_dir: /data/mimir/compactor
sharding_ring:
kvstore:
store: memberlist
|
5. loki config 설정
[root@localhost ~]# vi /APP/monitoring/loki/config/loki-config.yaml
|
# 대규모 로그 집계 엔진 설정
auth_enabled: false
server:
http_listen_port: 3100
grpc_listen_port: 9095
common:
path_prefix: /loki
replication_factor: 1
ring:
instance_addr: 127.0.0.1
kvstore:
store: inmemory
schema_config:
configs:
- from: 2024-01-01
store: tsdb
object_store: filesystem
schema: v13
index:
prefix: index_
period: 24h
storage_config:
filesystem:
directory: /loki/chunks
limits_config:
reject_old_samples: true
reject_old_samples_max_age: 168h
|
6. Tempo YAML 설정
[root@localhost ~]# vi /APP/monitoring/tempo/config/tempo.yaml
|
# Tempo Single Binary Configuration
server:
http_listen_port: 3200
distributor:
receivers:
otlp:
protocols:
grpc:
http:
storage:
trace:
backend: local
local:
path: /var/tempo/blocks
wal:
path: /var/tempo/wal
memberlist:
abort_if_cluster_join_fails: false
join_members:
- 127.0.0.1
|
7. Alloy config 설정
[root@localhost ~]# vi /APP/monitoring/alloy/config/config.alloy
|
// 로컬 메트릭 수집
prometheus.remote_write "mimir" {
endpoint {
url = "http://mimir:9009/api/v1/push"
}
}
// 로컬 로그 수집
loki.write "loki" {
endpoint {
url = "http://loki:3100/loki/api/v1/push"
}
}
// 수집 파이프라인
local.file_match "system_logs" {
path_targets = [{__path__ = "/var/log/messages"}]
}
loki.source.file "syslog" {
targets = local.file_match.system_logs.targets
forward_to = [loki.write.loki.receiver]
}
|
8. Grafana 서비스 유닛 파일 생성
[root@localhost ~]# vi /etc/systemd/system/grafana.service
|
[Unit]
Description=Grafana Container Service via Podman
After=network-online.target
Requires=podman.socket
[Service]
Type=oneshot
RemainAfterExit=yes
WorkingDirectory=/APP/monitoring/compose
ExecStart=/usr/bin/podman-compose -p grafana_stack up -d
ExecStop=/usr/bin/podman-compose -p grafana_stack down
TimeoutStartSec=5min
[Install]
WantedBy=multi-user.target
|
9. Grafana 서비스를 Systemd 등록 및 시작 설정
|
[root@localhost ~]# systemctl enable grafana.service
[root@localhost ~]# systemctl start grafana.service
|
10. WEB UI 접속 : http://localhost_IP:3000
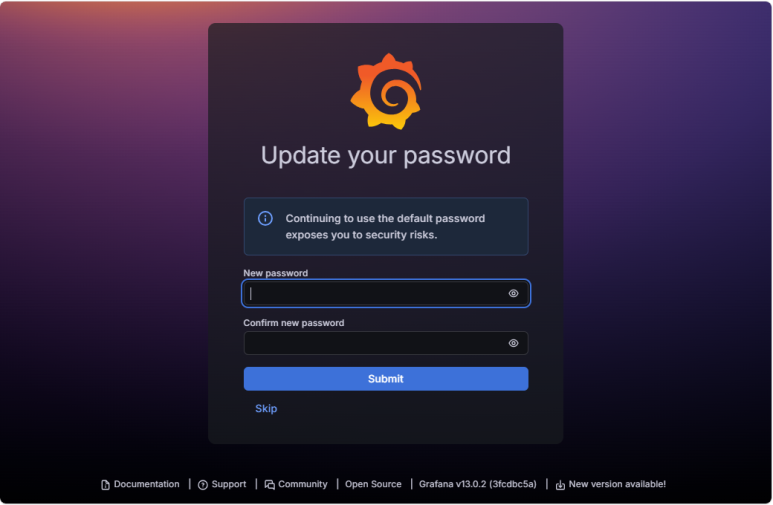
- Email or username : admin, Password : admin 입력

- 암호 변경
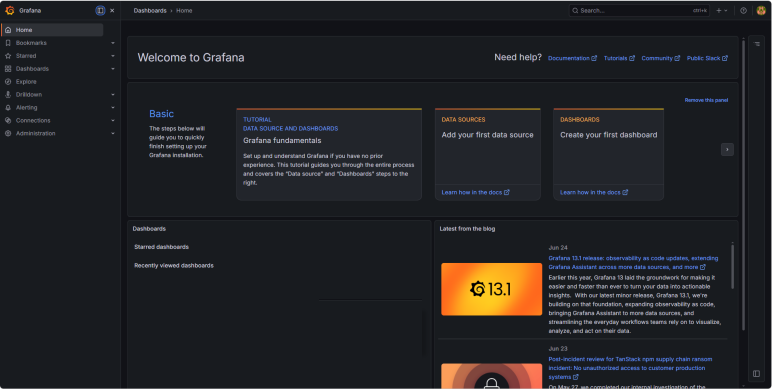
- 정상 접속 화면
'Observability Platform' 카테고리의 다른 글
| [Podman] Telegraf 설치 (0) | 2026.07.05 |
|---|---|
| [Podman] Influxdb 설치 (0) | 2026.07.04 |
| [Podman] Node Exporter 설치 (0) | 2026.07.04 |
| [Podman] VictoriaMetrics 설치 (0) | 2026.07.04 |
| [Podman] Prometheus 설치 (0) | 2026.07.04 |