▣ Prometheus 핵심 내용
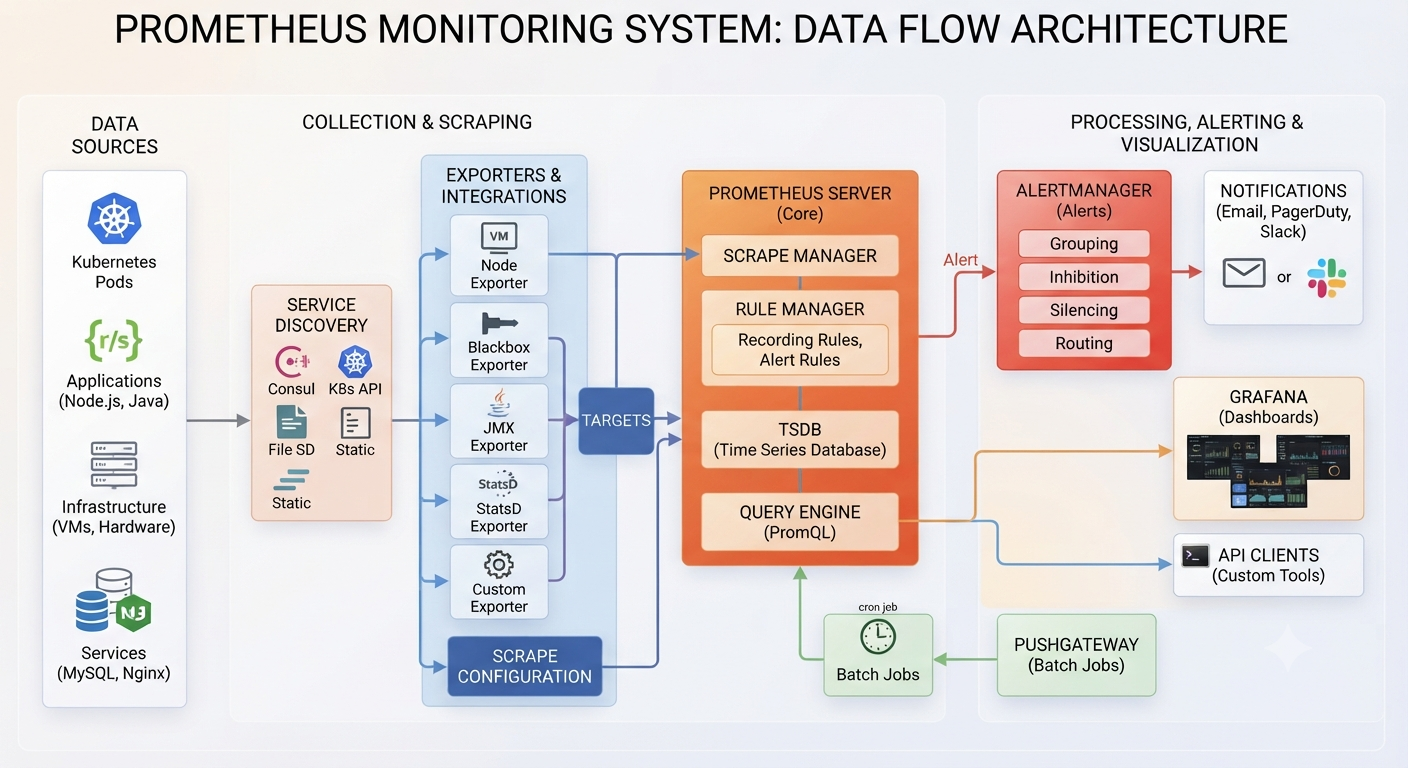
1. 역할 : 오픈소스 모니터링 및 경고(Alerting) 시스템이며, 그라파나와 함께 사용하여 시각화하는 경우가 많으며, 메트릭(Metric) 수집 최적화
2. 핵심 특징
| 역할 | 상세 내용 |
| 시계열 데이터 관리 | 시간 순서대로 변화하는 데이터를 저장하며, 고유한 메트릭 이름과 라벨(Label) 로 데이터를 구분 |
| Pull 방식 | 서버가 주기적으로 /metrics 엔드포인트를 스크래핑. Exporter(node_exporter, blackbox, snmp 등)로 수집 대상 확장 |
| 내장 TSDB | 데이터를 별도 DB 없이 로컬에 저장 (기본 15일 보존) |
| PromQL | 강력한 시계열 쿼리 언어 (rate(), increase(), histogram_quantile() 등) |
| Alertmanager | 조건 기반 알림 → Slack, Email, PagerDuty 등으로 라우팅 |
| Kubernetes 친화적 | Service Discovery, Pod annotation 자동 감지 |
3. 활용 범위
- 인프라/컨테이너/애플리케이션 메트릭 수집, 짧은 보존 주기의 운영 모니터링
4. Prometheus 데이터 흐름도
▣ Prometheus 설치 방법
1. 디렉토리 구조 및 권한 설정
|
[root@localhost ~]# mkdir -p /APP/monitoring/prometheus/compose
[root@localhost ~]# mkdir -p /APP/monitoring/prometheus/config
[root@localhost ~]# mkdir -p /APP/monitoring/prometheus/data
[root@localhost ~]# mkdir -p /APP/monitoring/prometheus/logs
[root@localhost ~]# chown -R 65534:65534 /APP/monitoring/prometheus/data
[root@localhost ~]# chown -R 65534:65534 /APP/monitoring/prometheus/config
|
2. 환경 변수 설정 (.env)
[root@localhost ~]# vi /APP/monitoring/prometheus/compose/.env
|
PROMETHEUS_VERSION=latest
HTTP_PORT=9073
DATA_RETENTION=15d
PROMETHEUS_IP=0.0.0.0 #locahostip 입력
|
3. podman-compose.yml 작성
[root@localhost ~]# vi /APP/monitoring/prometheus/compose/podman-compose.yml
|
version: '3.8'
services:
prometheus:
image: docker.io/prom/prometheus:${PROMETHEUS_VERSION}
container_name: prometheus
restart: always
ports:
- "${PROMETHEUS_IP}:${HTTP_PORT}:9090"
volumes:
- ../config:/etc/prometheus:z
- ../data:/prometheus:z
command:
- '--config.file=/etc/prometheus/prometheus.yml'
- '--storage.tsdb.path=/prometheus'
- '--storage.tsdb.retention.time=${DATA_RETENTION}'
- '--web.console.libraries=/usr/share/prometheus/console_libraries'
- '--web.console.templates=/usr/share/prometheus/consoles'
|
4. Prometheus YAML 설정
[root@localhost ~]# vi /APP/monitoring/prometheus/config/prometheus.yml
|
global:
scrape_interval: 15s # Set the scrape interval to every 15 seconds. Default is every 1 minute.
evaluation_interval: 15s # Evaluate rules every 15 seconds. The default is every 1 minute.
# scrape_timeout is set to the global default (10s).
# Alertmanager configuration
alerting:
alertmanagers:
- static_configs:
- targets:
# - alertmanager:9093
# Load rules once and periodically evaluate them according to the global 'evaluation_interval'.
rule_files:
# - "first_rules.yml"
# - "second_rules.yml"
# A scrape configuration containing exactly one endpoint to scrape:
# Here it's Prometheus itself.
scrape_configs:
# The job name is added as a label `job=<job_name>` to any timeseries scraped from this config.
- job_name: "prometheus"
static_configs:
- targets: ["0.0.0.0:9073"] #localhostip 입력.
labels:
application: 'Prometheus'
|
5. Prometheus 서비스 유닛 파일 생성
[root@localhost ~]# vi /etc/systemd/system/prometheus.service
|
[Unit]
Description=Prometheus Podman Compose Service
After=network-online.target podman.service
Wants=network-online.target
[Service]
Type=oneshot
RemainAfterExit=yes
WorkingDirectory=/APP/monitoring/prometheus/compose
ExecStart=/usr/bin/podman-compose -p prometheus_stack up -d
ExecStop=/usr/bin/podman-compose -p prometheus_stack down
TimeoutStartSec=3min
[Install]
WantedBy=multi-user.target
|
6. Prometheus 서비스를 Systemd 등록 및 시작 설정
|
[root@localhost ~]# systemctl enable prometheus.service
[root@localhost ~]# systemctl start prometheus.service
|
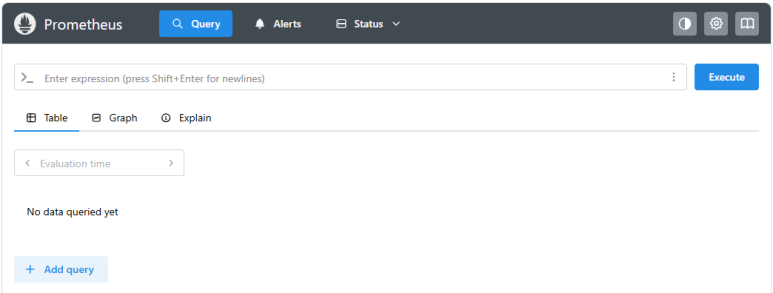
7. Prometheus WEB UI 접속 : http://localhost_IP:9073
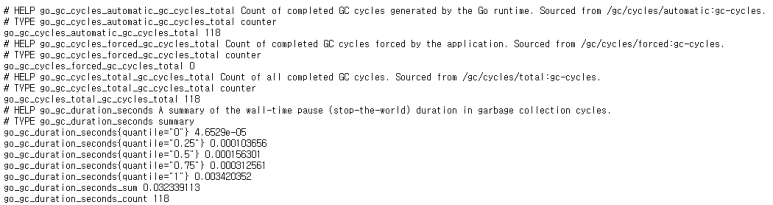
8. Prometheus Metrics UI 확인 : http://localhost_IP:9073/metrics
'Observability Platform' 카테고리의 다른 글
| [Podman] Telegraf 설치 (0) | 2026.07.05 |
|---|---|
| [Podman] Influxdb 설치 (0) | 2026.07.04 |
| [Podman] Node Exporter 설치 (0) | 2026.07.04 |
| [Podman] VictoriaMetrics 설치 (0) | 2026.07.04 |
| [Podman] Grafana 설치 (0) | 2026.07.04 |